Monitoring Apache Kafka with Grafana / InfluxDB via JMX
Monitoring servers or infrastructure usually comes into play, when all bits look fine and are ready to be deployed to production. Then suddenly one question arises: how do we monitor the wellness of our deployment. One solution is to outsource it. For Apache Kafka performance monitoring there are a couple of offerings available, like:
However it might not suit you to integrate with a 3rd party provider for a couple of reasons, but also you may have already built a self-hosted monitoring infrastructure for other services.
In this post I'd like to show how easy it is to retrieve metrics from Kafka, send them to InfluxDB and use Grafana for visualisation. A similar approach, just for Cassandra, has been described in our blog post series.
Monitoring Infrastructure
The examples here will be mainly based on Docker to keep things simple, but if you require assistance in setting up a production ready monitoring environment, feel free to contact us. For the same reason JMX authentication and authorization is out of scope for this post, however keep in mind that it is supported.
InfluxDB
The datastore for all the metrics will be InfluxDB. Having Docker installed, it can be started with:
$ docker network create monitoring-network

$ docker run -d -p 8083:8083 -p 8086:8086 \
    --net monitoring-network  \
    --name influxdb  \
    influxdb:0.13.0

$ curl -POST http://INFLUXDB_IP:8086/query --data-urlencode "q=CREATE DATABASE kafka"
The monitoring-network network is required for the InfluxDB and Grafana containers to be able to communicate with each other. This post - the second part about Cassandra monitoring, explains it in more detail.
Grafana
Again, we're using Docker for this:
$ docker run -d -p 3000:3000 --net monitoring-network --name grafana grafana/grafana:3.1.0

$ curl 'http://admin:admin@GRAFANA_IP:3000/api/datasources' -X POST \
-H 'Content-Type: application/json;charset=UTF-8' \
--data-binary '{"name":"influx","type":"influxdb","url":"http://influxdb:8086",
"access":"proxy","isDefault":true,"database":"kafka","user":"admin","password":"admin"}'
Kafka
Kafka metrics will be gathered via JMX. I know, not a perfect solution, it has drawbacks and I'm going to address the later in this post. To expose metrics via remote JMX, a JMX port has to be chosen. This can be achieved by exporting JMX_PORT or starting Kafka like this:
kafka_2.11-0.10.0.1$ JMX_PORT=55555 ./bin/kafka-server-start.sh config/server.propertiesKafka(JMX) -> ??? -> InfluxDB
One interesting tool for this job is jmxtrans.
Let's download jmxtrans-259-all.jar and configure it to gather some
JVM metrics.
$ wget http://central.maven.org/maven2/org/jmxtrans/jmxtrans/259/jmxtrans-259-all.jar
$ cat jvm.json
{
"servers" : [ {
"port" : "55555",
"host" : "localhost",
"alias": "kafka-1",
"queries" : [ {
"outputWriters" : [
{
"@class" : "com.googlecode.jmxtrans.model.output.InfluxDbWriterFactory",
"url" : "http://INFLUXDB_IP:8086/",
"database" : "kafka",
"username" : "admin",
"password" : "admin"
} ],
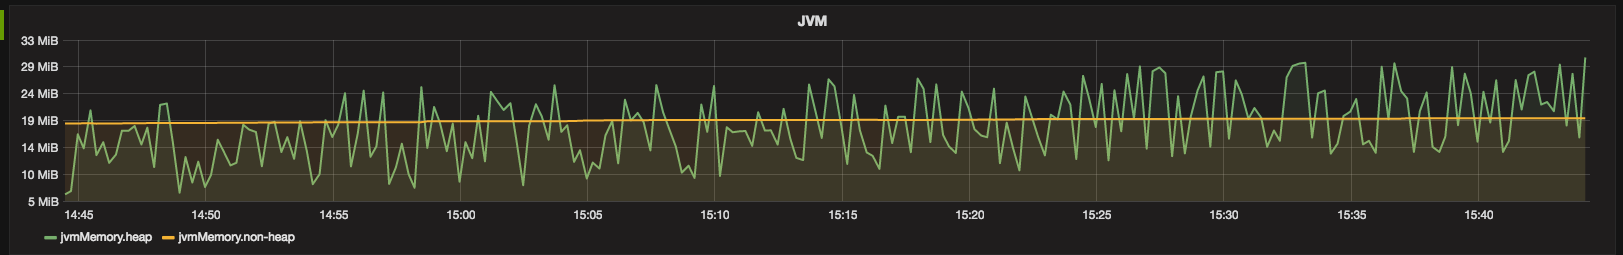
"obj" : "java.lang:type=Memory",
"attr" : [ "HeapMemoryUsage", "NonHeapMemoryUsage" ],
"resultAlias" : "jvmMemory"
}
],
"numQueryThreads" : 1
} ]
}
The port and host fields are access details to the Kafka broker. The alias field will uniquely identify a broker's metrics in Grafana.
The resultAlias is a container the metrics will be available from. See the screenshot below to get an idea what is what.
If we would have followed the installation instructions, we could just fire up this thing, however since we downloaded the jar from maven, we need the startup script and then we're good to go:
$ wget -q https://raw.githubusercontent.com/jmxtrans/jmxtrans/master/jmxtrans/jmxtrans.sh

$ chmod +x jmxtrans.sh

$ JAR_FILE=jmxtrans-259-all.jar ./jmxtrans.sh start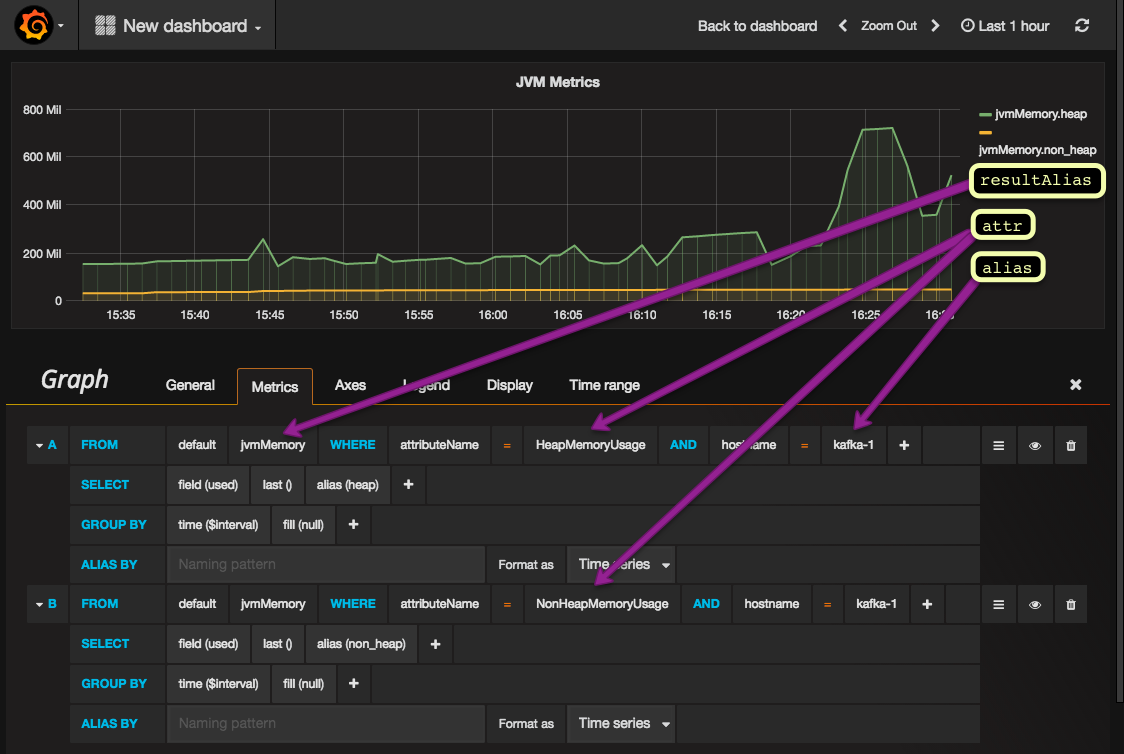
By default the poll period is set to 60 seconds and can be adjusted via SECONDS_BETWEEN_RUNS.
Grafana
The picture above says it all. We are able to gather metrics from Kafka and visualise them in Grafana.
By default the Web UI is available at http://GRAFANA_IP:3000.
Metrics everywhere
Now you may wonder, what do I need to look at? Based on our experience, but also inspired by Kafka's documentation, a very interesting and informative blog post and finally another post on this topic I've provided a config file for jmxtrans. Some parameters have been extracted, like URLs and credentials to make it easier to adjust it with environment variables. The jmxtrans script has to be executed with JMXTRANS_OPTS:
$ JMXTRANS_OPTS="-Dport1=55555 -Durl1=localhost -DinfluxUrl=http://INFLUXDB_IP:8086/ -DinfluxDb=kafka -DinfluxUser=admin -DinfluxPwd=admin" \
    JAR_FILE=jmxtrans-259-all.jar ./jmxtrans.sh start
A corresponding Grafana Dashboard to import is also available.
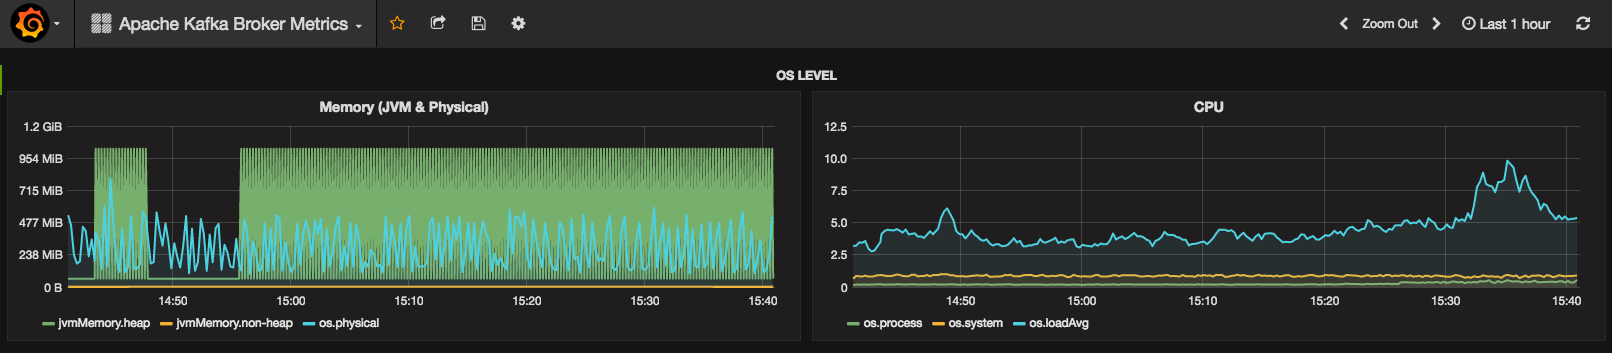
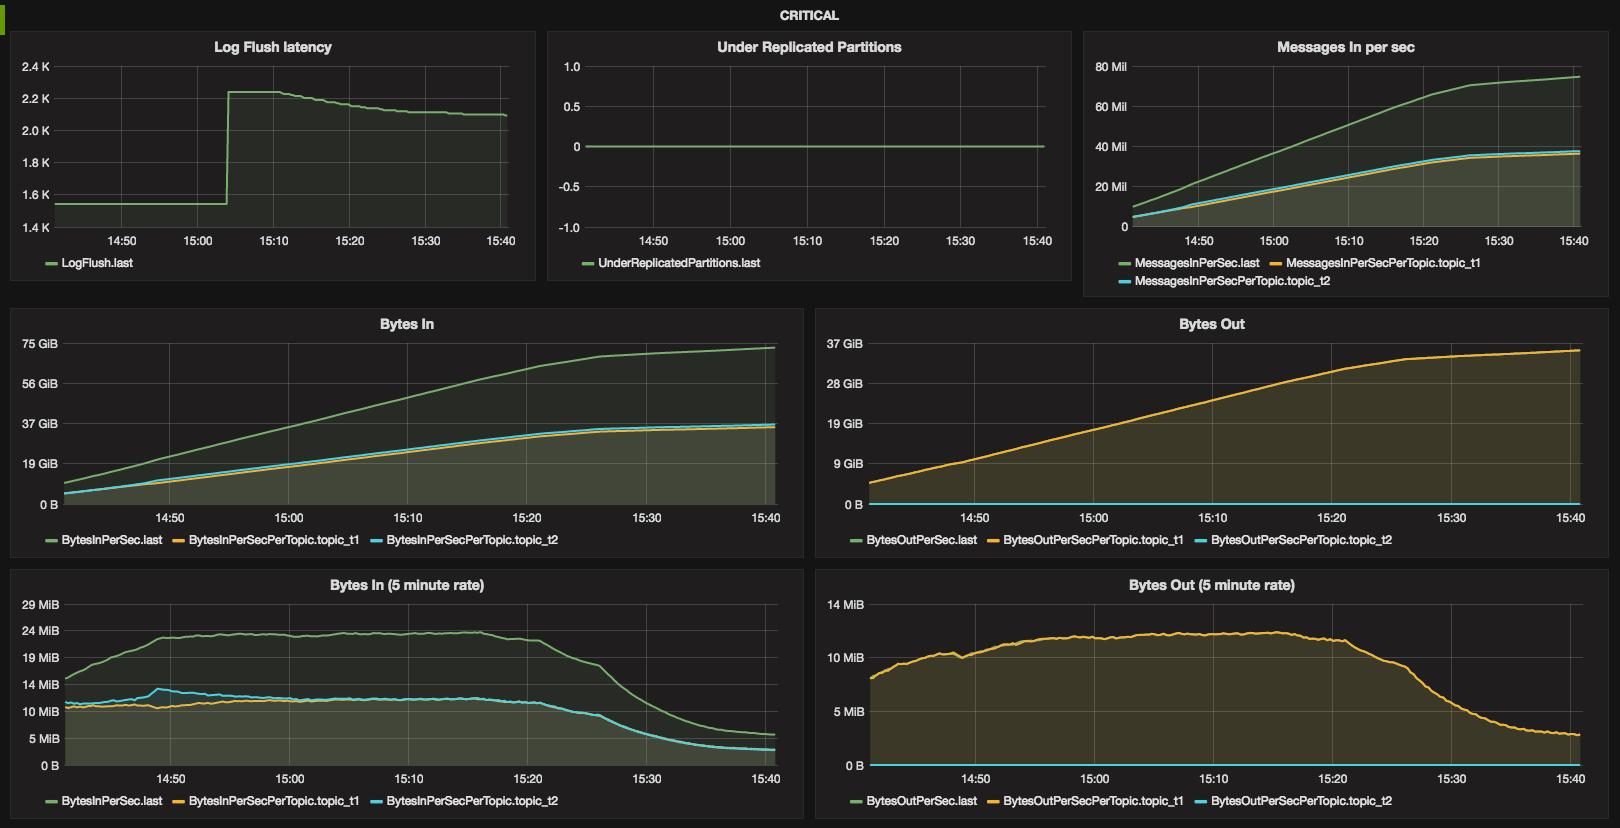
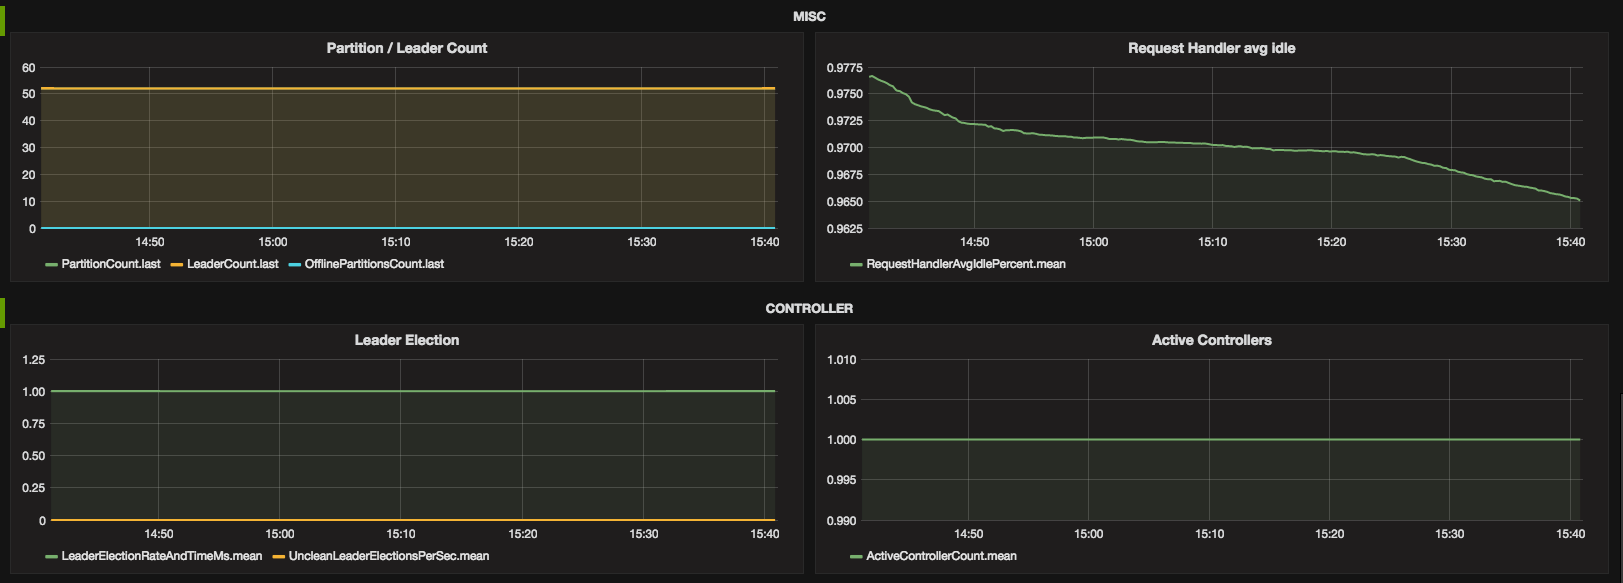
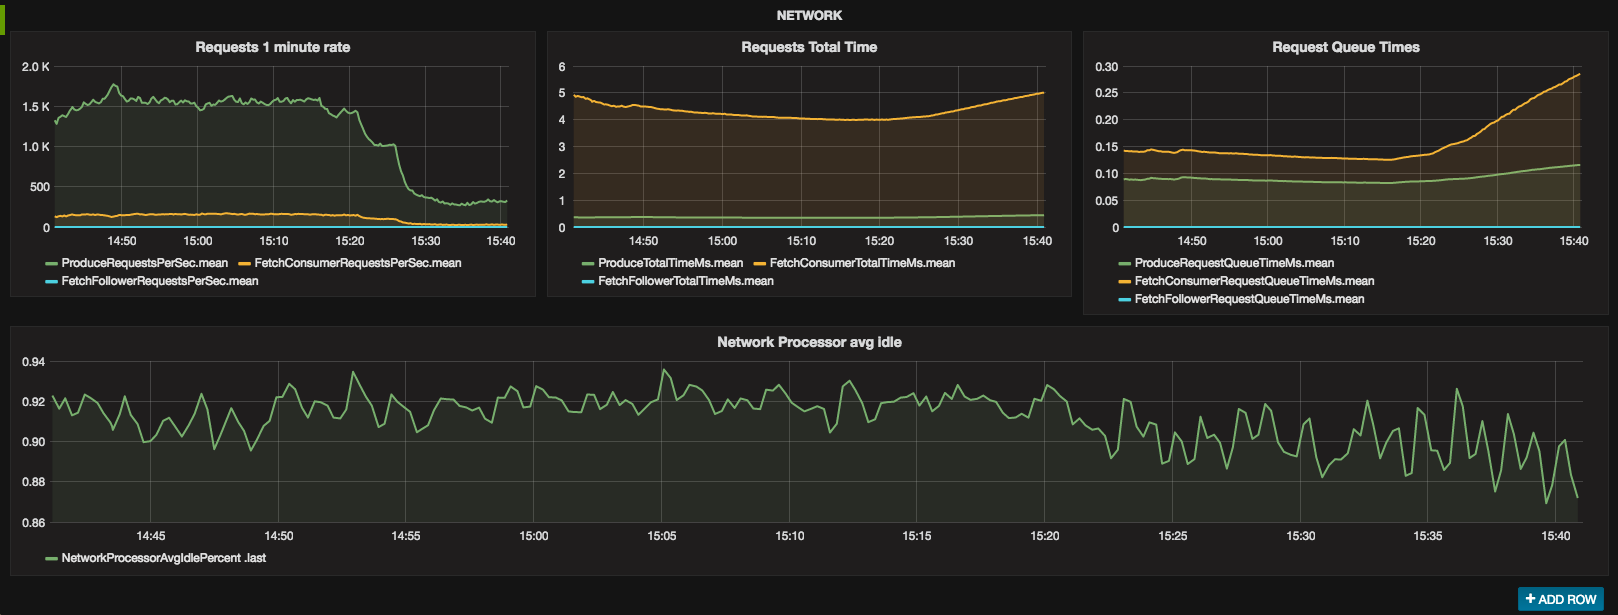
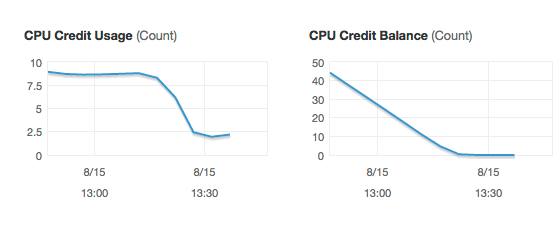
If you wonder, why there is a drop around 15:20, I ran out of CPU credits on an Amazon t2 instance.
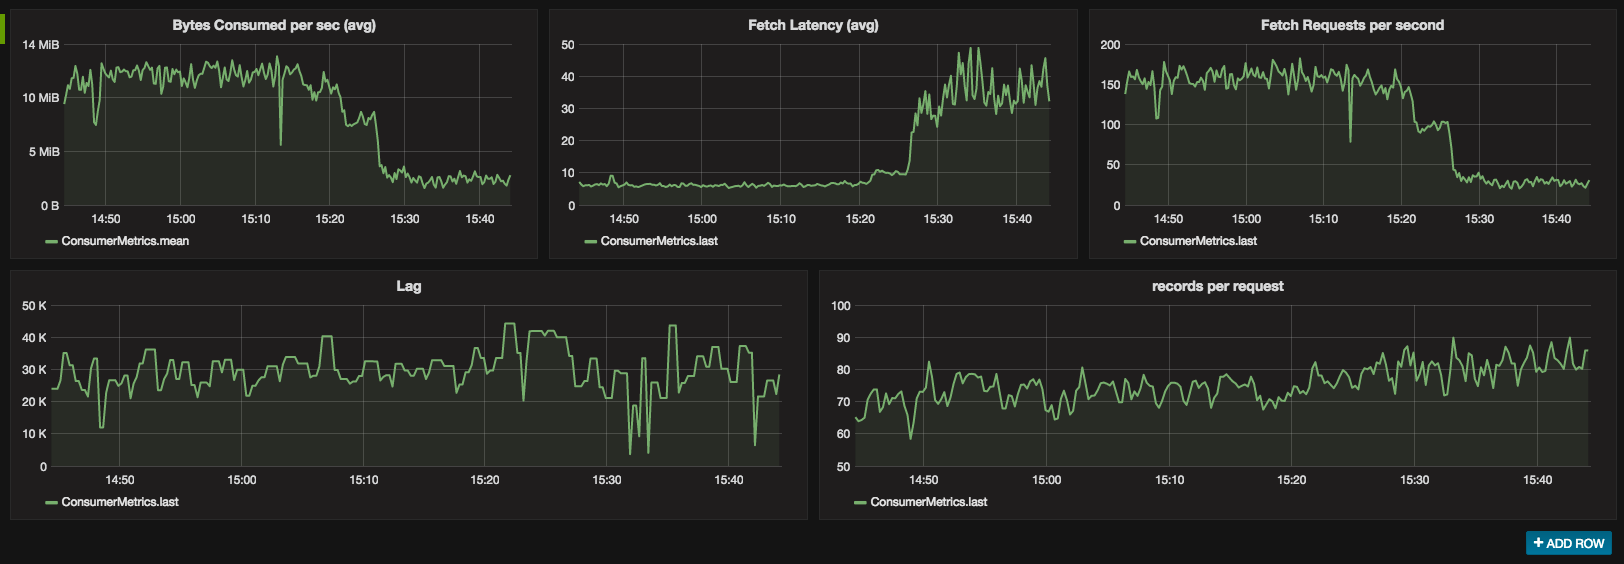
Consumer metrics
Besides the broker metrics it is also crucial to measure the Consumer, especially how much it lags behind. This can be achieved by starting the Consumer with additional VM options:
-Dcom.sun.management.jmxremote.port=44444 -Dcom.sun.management.jmxremote.ssl=false -Dcom.sun.management.jmxremote.authenticate=false
Then jmxtrans again can be used to read all the required numbers and send them over to InfluxDB.
$ JMXTRANS_OPTS="-Dport1=44444 -Durl1=localhost -DinfluxUrl=http://INFLUXDB_IP:8086/ -DinfluxDb=kafka -DinfluxUser=admin -DinfluxPwd=admin" \
    SECONDS_BETWEEN_RUNS=15 JAR_FILE=jmxtrans-259-all.jar ./jmxtrans.sh start
A sample jmxtrans config file and a Grafana dashboard are available on GitHub.
Below are screenshots of some Consumer metrics.
It's worth to note, that the Producer, the Kafka Connect framework and the Kafka Streams library exposes metrics
via JMX as well.
Why, oh why JMX
Out of the box, Kafka exposes its metrics via JMX. As far as I know, that's the only supported way to retrieve metrics. However there are a couple of dedicated metrics reporters for Kafka available on GitHub. They are plugged in to Kafka and configured through the server.properties file to send metrics to a given resource, like Graphite for example. That makes the deployment easier, being just a matter of putting a jar file into Kafka's lib directory and setting some properties. No JMX polling, authentication and authorization and additional process (jmxtrans) to carry for.
InfluxDB metrics reporter
As of now, I haven't found a way to report directly to InfluxDB, other than via jmxtrans or a graphite reporter. However there is an InfluxDB Reporter available from iZettle. The bad new is, that it requires io.dropwizard.metrics:metrics-core:3.1.2 where Kafka still depends on the oldercom.yammer.metrics:metrics-core:2.2.0.
Check: Hands-on InfluxDB
Getting Real!
One topic not covered yet is the deployment scenario. Where should all this stuff be placed? For sure every Kafka broker and probably Zookeeper node deserve their own boxes. Also Grafana and InfluxDB could be deployed separately. But what about jmxtrans? Should it live together with Kafka on the same box ending up with one jmxtrans process per Kafka node? Or should it rather be deployed with InfluxDB? Finally we could burn some money and put it on a separate box.
As usual, it depends. One argument for running jmxtrans on each of the Kafka brokers is that if a broker goes down, there's no value in the jmxtrans instance anyway. One could prepare a Docker image / Ansible playbook / Chef cookbook or whatever else is out there and have one package with the whole thing.
On the other side, a Docker image for example, should be kept as simple as possible. I know, I know, it's just a suggestion to keep one service per container ;)
Besides that, having just one jmxtrans instance - is it deployed on a dedicated box or on the InfluxDB server - allows us to maintain the whole configuration in one place. But then, in case we have to pass a firewall to access JMX, we'll need to configure every Kafka broker with additional-Dcom.sun.management.jmxremote.rmi.port=$JMX_PORT -Djava.rmi.server.hostname=<IP accessible by jmxtrans> parameters.
That's a brief take on Apache Kafka alerting with Grafana / InfluxDB via JMX.
I'd love to hear your opinion on this topic.
