TigerBeetle vs PostgreSQL Performance: Benchmark Harness, Cloud Tests
A few months ago, we tested the performance of TigerBeetle and PostgreSQL in local benchmarks. The test replicated the typical workflow for TigerBeetle’s use case, namely, double-entry bookkeeping to create transfers.
We have seen that in the local setup, TigerBeetle was almost 3 times faster than the fastest PostgreSQL approach, but we still have the question of whether that is also the case when deployed in a cluster setup on dedicated servers. That is what we will try to find out.
As usual, the benchmarks’ code is available on GitHub if you’d prefer to explore and run the tests yourself.
Quick reminder: PostgreSQL schema
TigerBeetle has a fixed schema that supports only double-entry bookkeeping. There are three main entities: ledgers, accounts, and transfers. A transfer always involves two accounts: one is credited, while the other is debited. As mentioned above, creating a transfer is the main database operation. Here’s a similar schema we use for this test in PostgreSQL:
CREATE TABLE IF NOT EXISTS accounts (
    id BIGINT PRIMARY KEY,
    balance BIGINT NOT NULL DEFAULT 0,
    CONSTRAINT balance_non_negative CHECK (balance >= 0)
);

CREATE TABLE IF NOT EXISTS transfers (
    id BIGSERIAL PRIMARY KEY,
    source_id BIGINT NOT NULL REFERENCES accounts(id),
    dest_id BIGINT NOT NULL REFERENCES accounts(id),
    amount BIGINT NOT NULL,
    created_at TIMESTAMPTZ NOT NULL DEFAULT NOW(),
    CONSTRAINT amount_positive CHECK (amount > 0),
    CONSTRAINT different_accounts CHECK (source_id != dest_id)
);

CREATE INDEX IF NOT EXISTS idx_transfers_source ON transfers(source_id);
CREATE INDEX IF NOT EXISTS idx_transfers_dest ON transfers(dest_id);
CREATE INDEX IF NOT EXISTS idx_transfers_created_at ON transfers(created_at);
We will test 2 strategies for creating transfers in PostgreSQL (implicit locking and explicit locking). All of them can be found here. Since we described them in the last post, we will not repeat them here. If you need a reminder, visit our post about local tests.
Performance benchmark in the cloud
Last time we ran locally, one database instance and one client. For more real-world scenarios, we will run a cluster for each database and 5 client instances. TigerBeetle recommends six nodes across three cloud providers; we used three for this test to match the PostgreSQL setup, configured for its usual leader + 2 replicas consensus. Likewise, we used a similar setup for PostgreSQL with one primary and two synchronous standbys (quorum commit, so transactions are acknowledged only after they’re durable on primary and at least one standby).
These benchmarks were performed on Google Cloud Platform. In addition to the mentioned instances for clients and the database, we also have one node running our monitoring stack with Prometheus and Grafana.
For clients, we used n2-standard-2 (2 vCPUs, 8 GB of RAM) instances, and for the database, we used n2-highmem-4 (4 vCPUs, 32 GB of RAM) instances. You can check all the infrastructure defined in the /terraform directory of our repo.
Measurements and variables
Before discussing the methodology and results, let’s talk about what we want to measure and the variables we can control. Let’s start with variables:
target_rateis the total number of transfers that clients across all instances try to execute per second. We issue the requests regardless of how fast the database responds.max_concurrencyis a value that controls how many in-flight requests a client is allowed to have. We observed that clients sometimes dropped transfers due to too many in-flight requests, rather than the database failing to respond. We used this setting to raise the ceiling and allow more requests.
What we measure:
- mean throughput
- p50, p95, p99, p999 latency
- error rate
- dropped requests - requests that were dropped because of
max_concurrency, too many in-flight requests
Running and coordinating tests
The coordinator code is responsible for distributing the client’s code, starting the database, initializing accounts, and running the benchmark. We are still using Docker to deploy the database, but we use --security-opt seccomp=unconfined to enable io_uring since the host is not shared.
When it comes to client code, we don’t want to bring the full Rust and Zig toolchains to build the binary on instances. We are using cargo zigbuild to cross-compile the client’s binary and copy it onto VM instances.
Tests results
Let’s look at the results. Each test lasts 5 minutes, with a 2-minute warm-up and 3 iterations. We performed two tests for TigerBeetle and 6 for PostgreSQL. It stems from PostgreSQL's support for 2 different strategies. After these tests comparing the two databases, we also run a few other benchmarks to see how far we can push TigerBeetle. We also defined 2 types of account contention, characterized by the Zipfian exponent, resulting in “hotspot” accounts.
First test is to run 5k requests per second in fixed_rate mode.
| Metric | TigerBeetle | PostgreSQL Standard (FOR UPDATE) | PostgreSQL Atomic |
|---|---|---|---|
| Fixedrate (zipfian=1.0) | |||
| Test mode | fixed_rate | fixed_rate | fixed_rate |
| Mean throughput | 4,097 TPS | 2,890 TPS | 3,068 TPS |
| p50 latency | 32.3 ms | 324.7 ms | 303.7 ms |
| p95 latency | 508 ms | 581 ms | 556 ms |
| p99 latency | 748 ms | 960 ms | 927 ms |
| p999 latency | 987 ms | 1,492 ms | 1,473 ms |
| Error rate | 0% | 0% | 0% |
| Balance verified | 3/3 | 3/3 | 3/3 |
| Hotspot (zipfian=2.0) | |||
| Test mode | fixed_rate | fixed_rate | fixed_rate |
| Mean throughput | 4,461 TPS | 753 TPS | 977 TPS |
| p50 latency | 32.1 ms | 1,306 ms | 1,001 ms |
| p95 latency | 358 ms | 1,890 ms | 1,472 ms |
| p99 latency | 560 ms | 2,123 ms | 1,821 ms |
| p999 latency | 726 ms | 2,916 ms | 3,138 ms |
| Error rate | 0% | 0% | 0% |
| Balance verified | 3/3 | 3/3 | 3/3 |
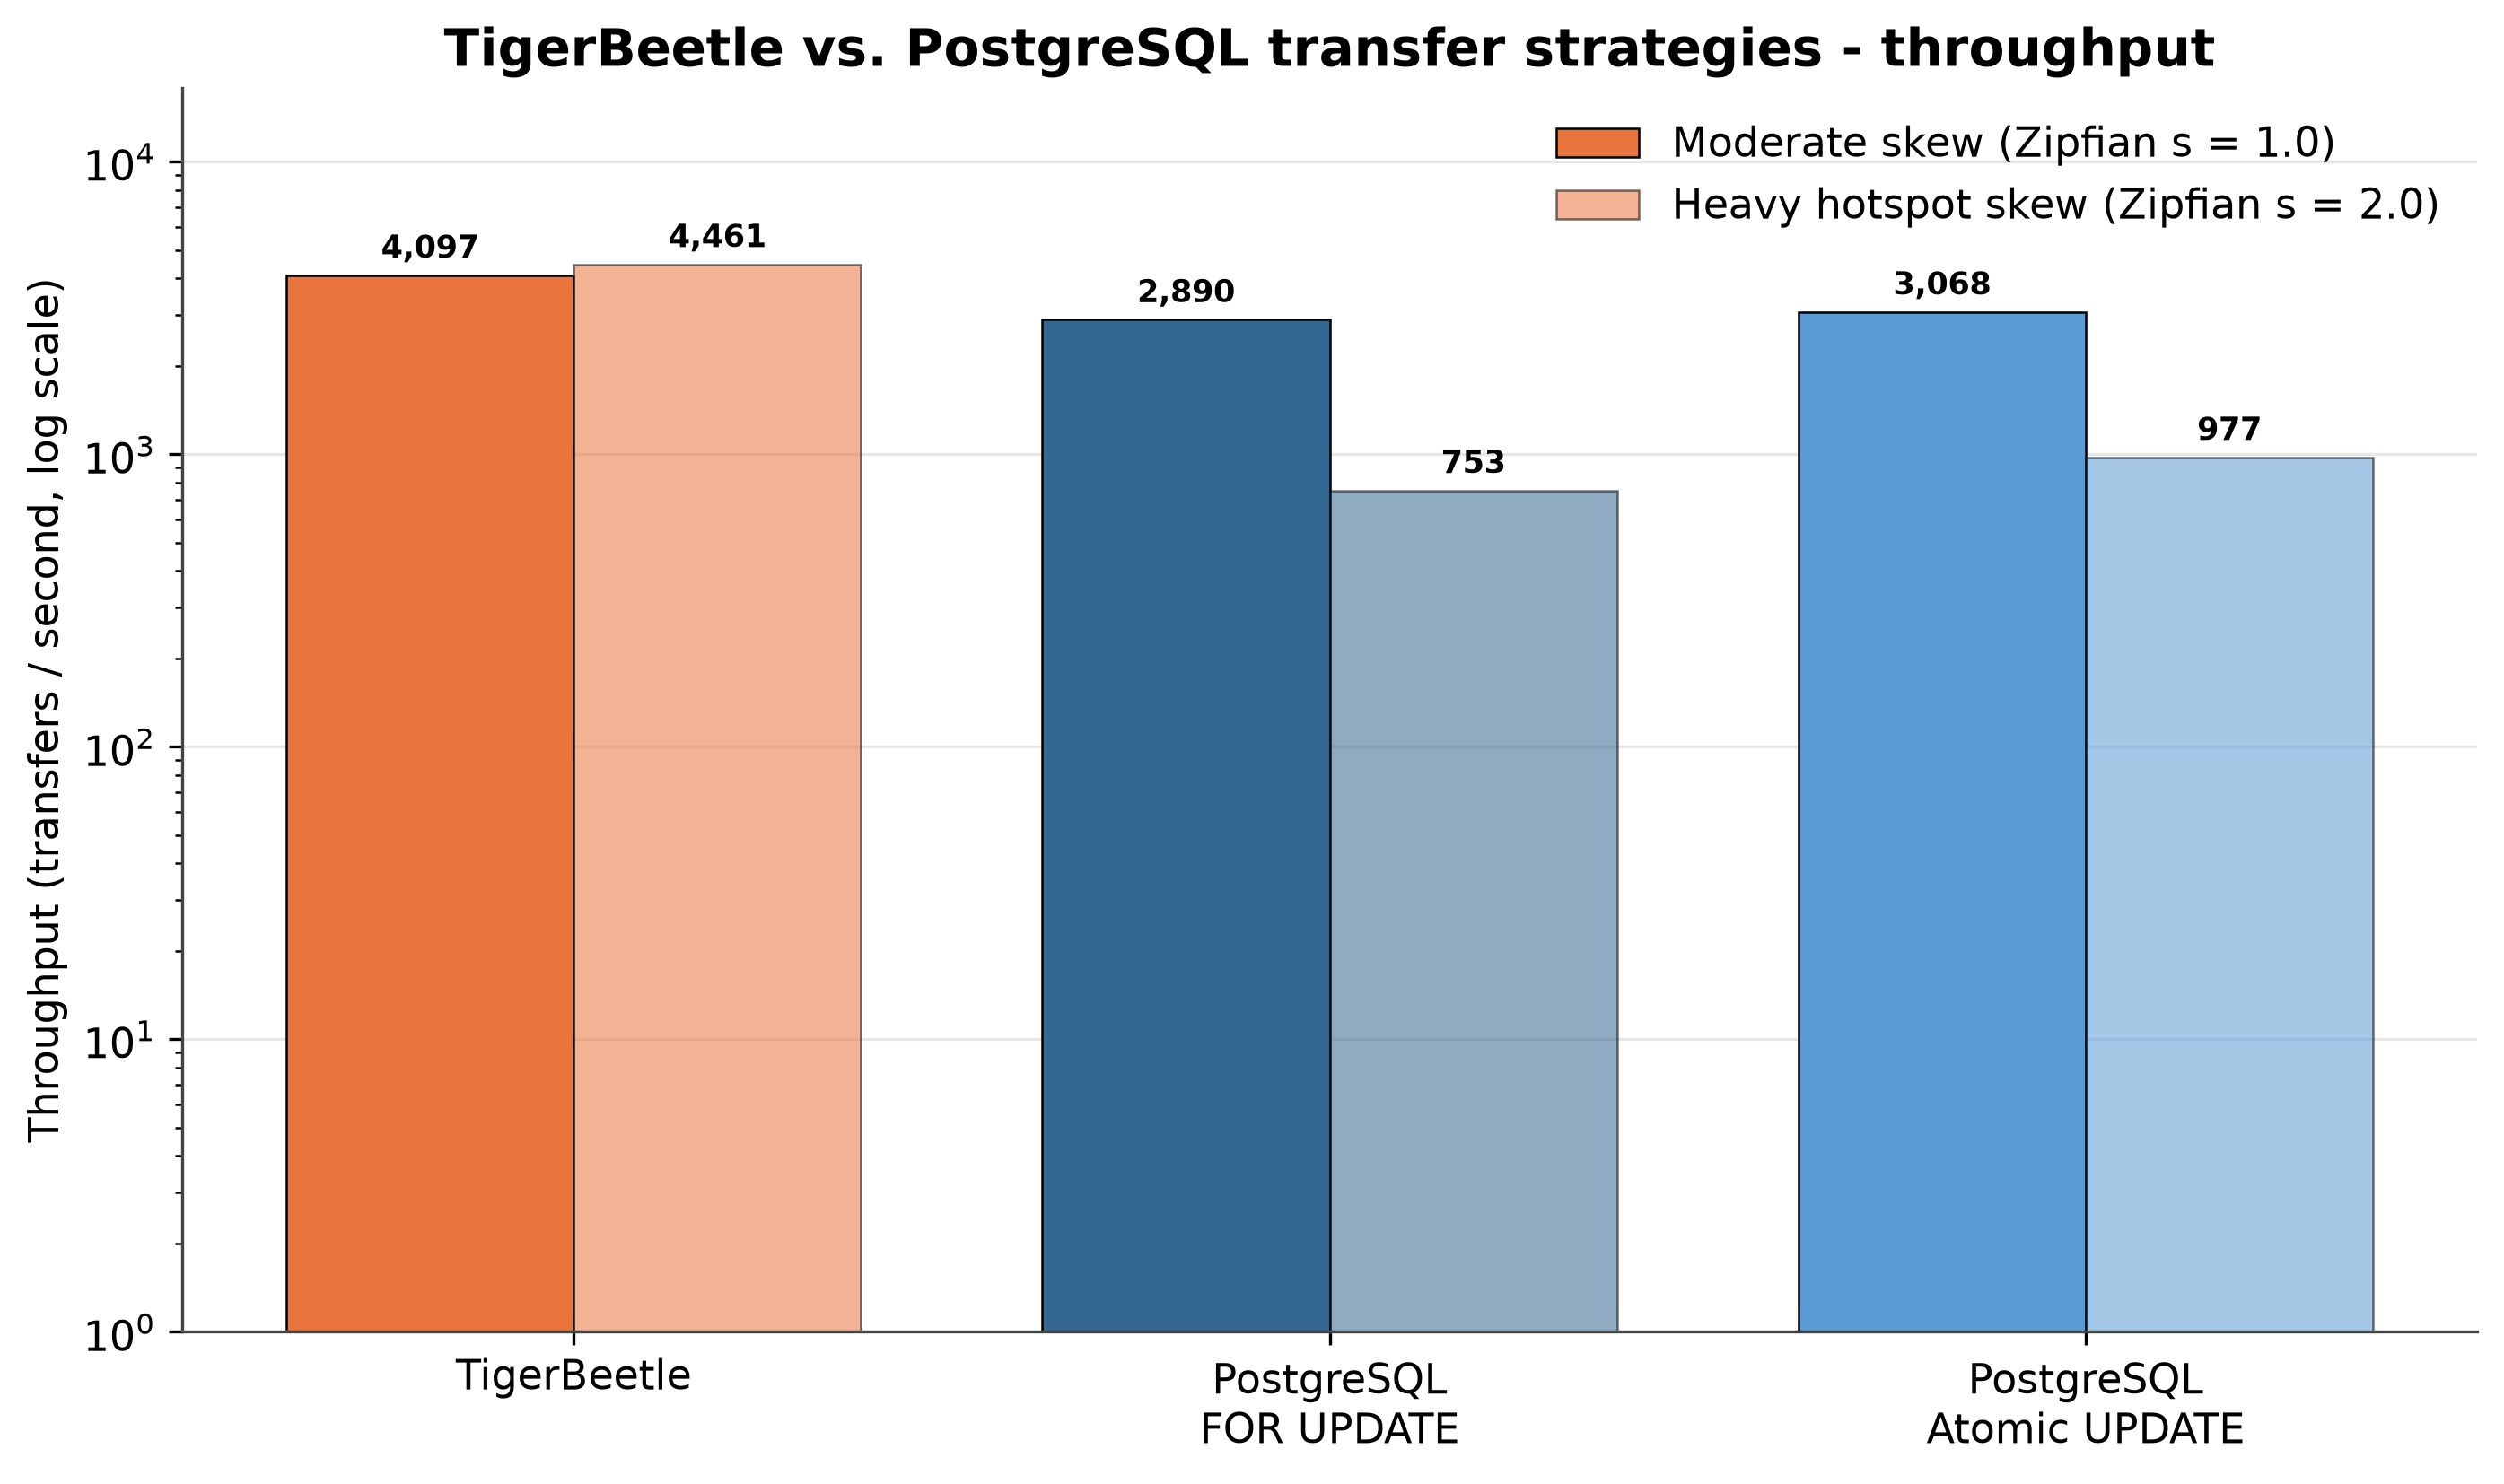
TigerBeetle’s throughput is about 33% higher than the most effective PostgreSQL strategy. We can also see that with higher skew and more “hot” accounts, TigerBeetle retains performance, but PostgreSQL's row-locking approach starts to slow down significantly. A single core is processing transfers in order, so there’s nothing to contend over, but on PostgreSQL, we have to wait when multiple connections try to modify the same row. TigerBeetle almost saturates the target rate. We will see that in the next benchmarks, we achieve the target rate. We do this by allowing more in-flight requests, so clients don’t drop requests that would otherwise be fulfilled.
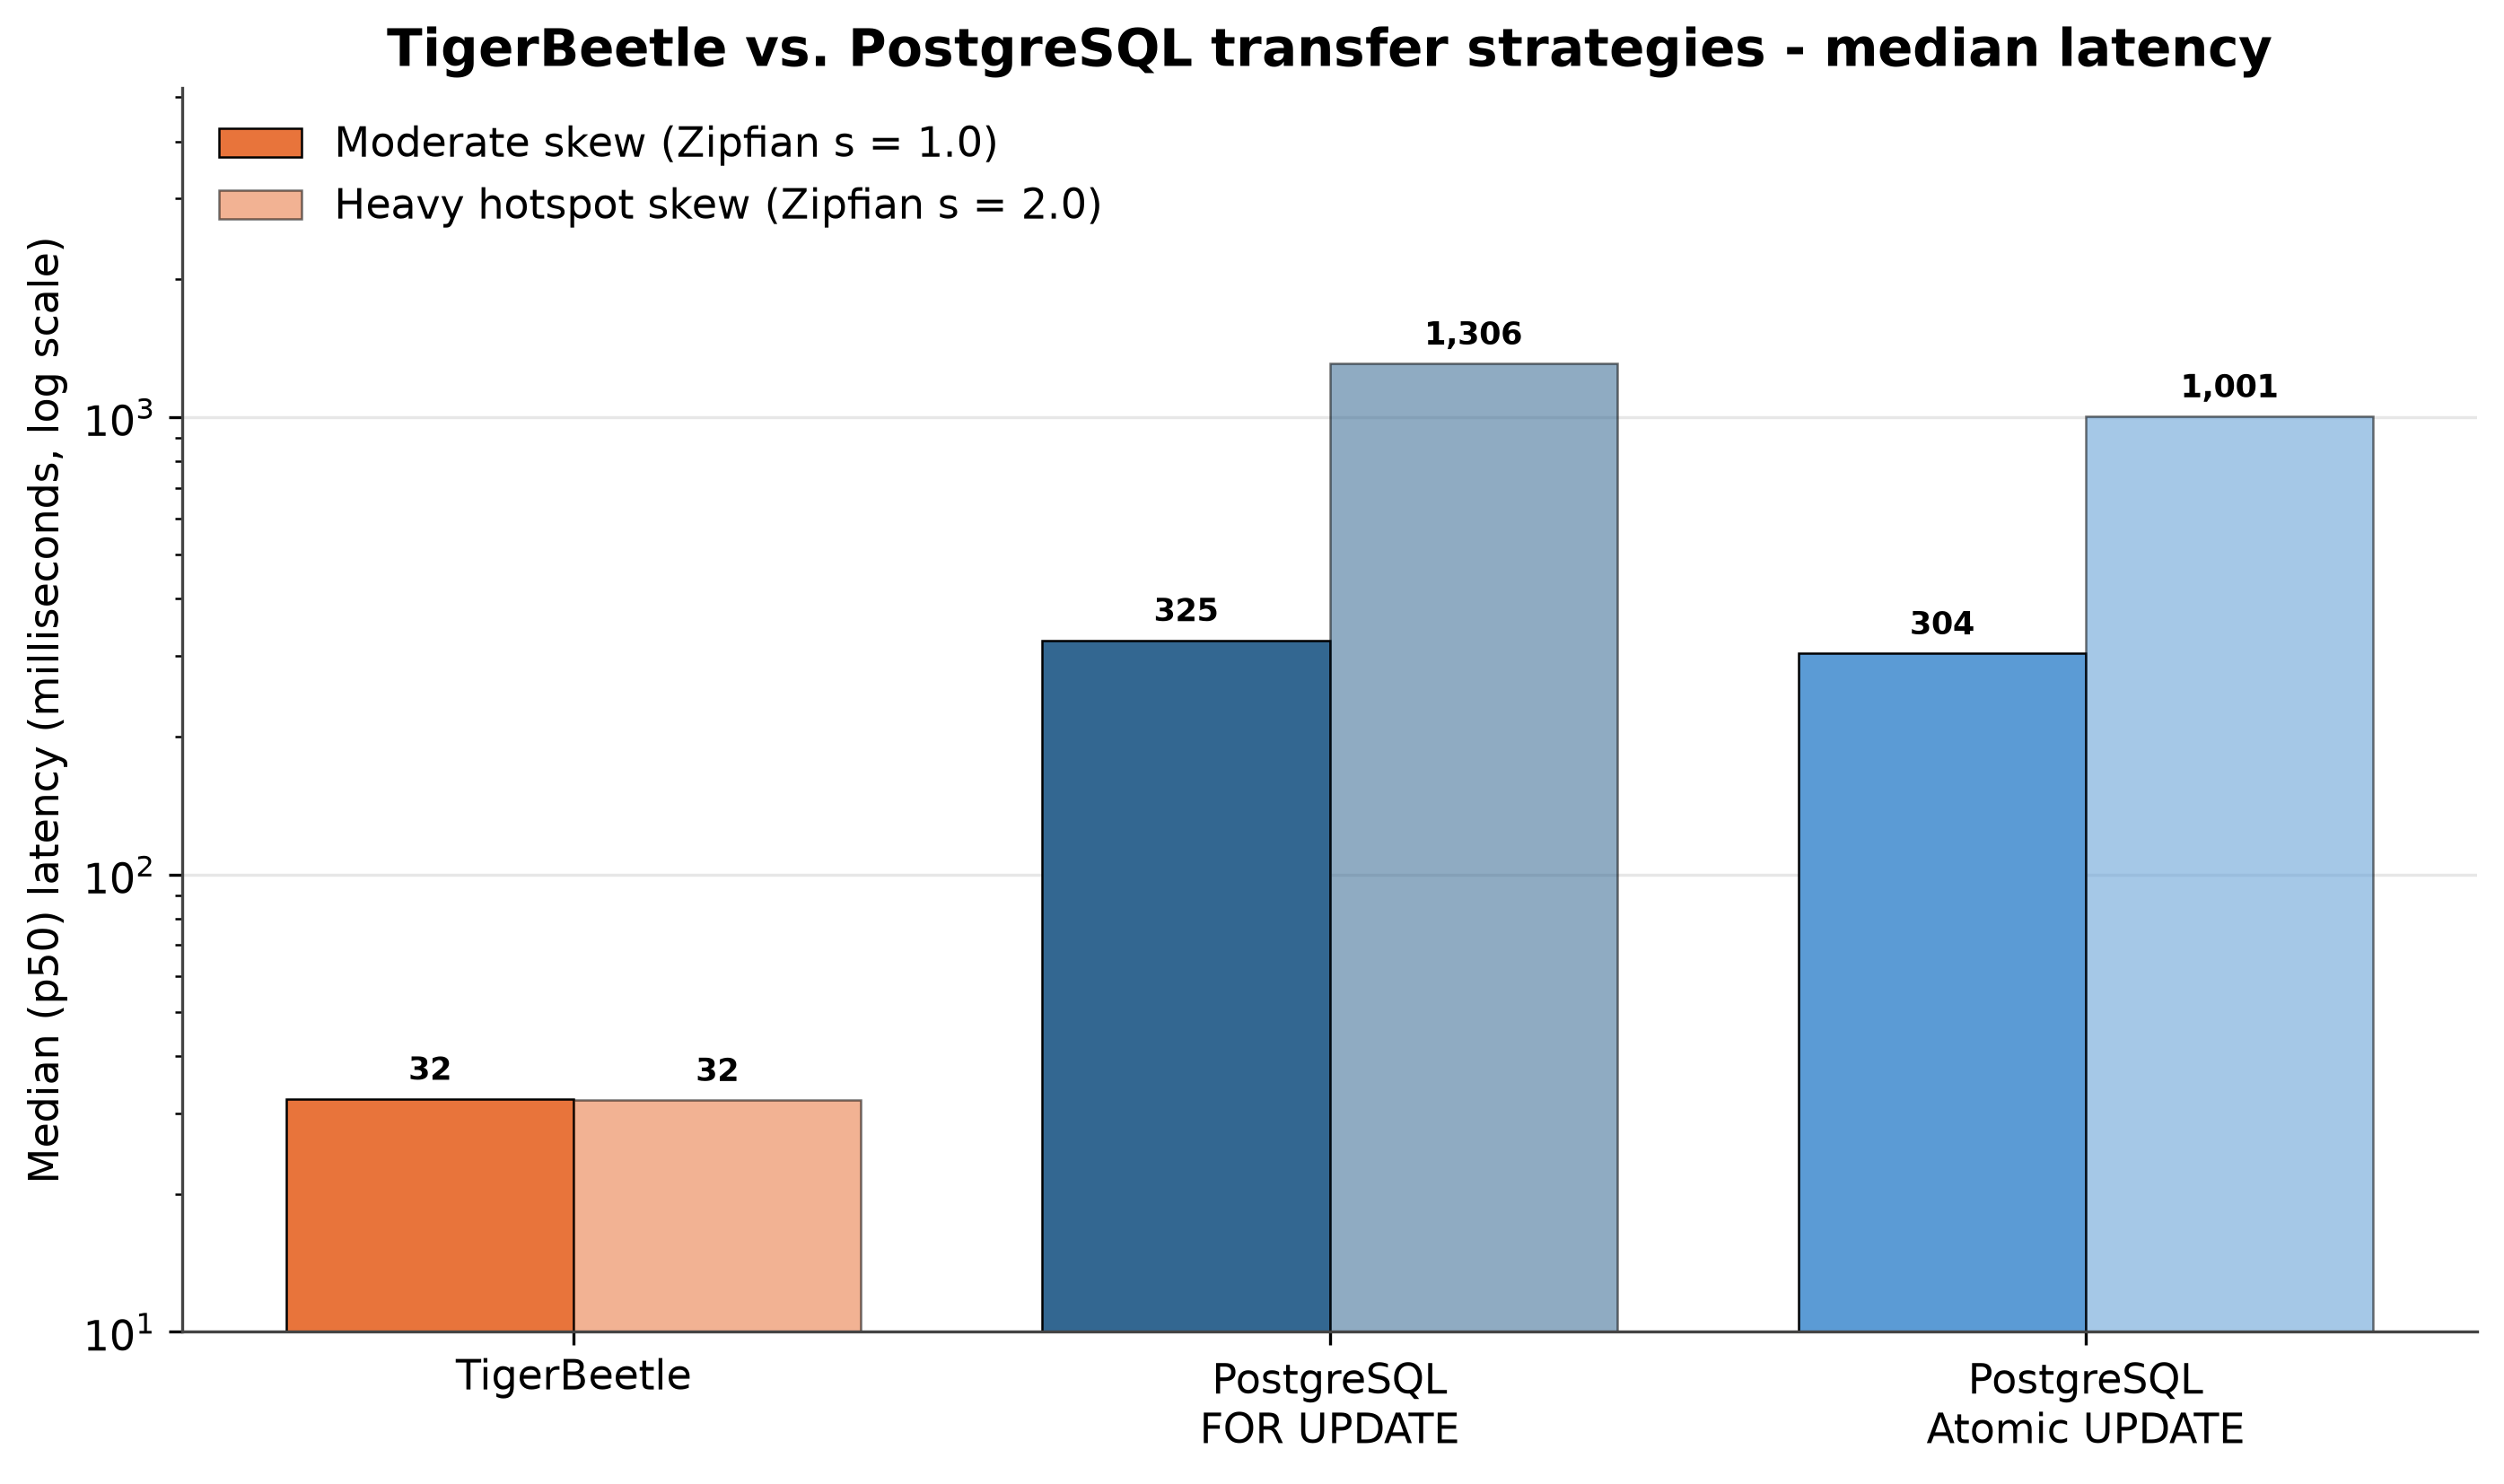
This plot shows a much more drastic difference in latency. TigerBeetle stays consistent no matter how many of the same accounts we hit, but PostgreSQL, due to locking, has to wait before it can update the row, resulting in higher overall latency and sometimes large spikes. Let’s look at different percentiles compared to FOR UPDATE in PostgreSQL for moderate skew.
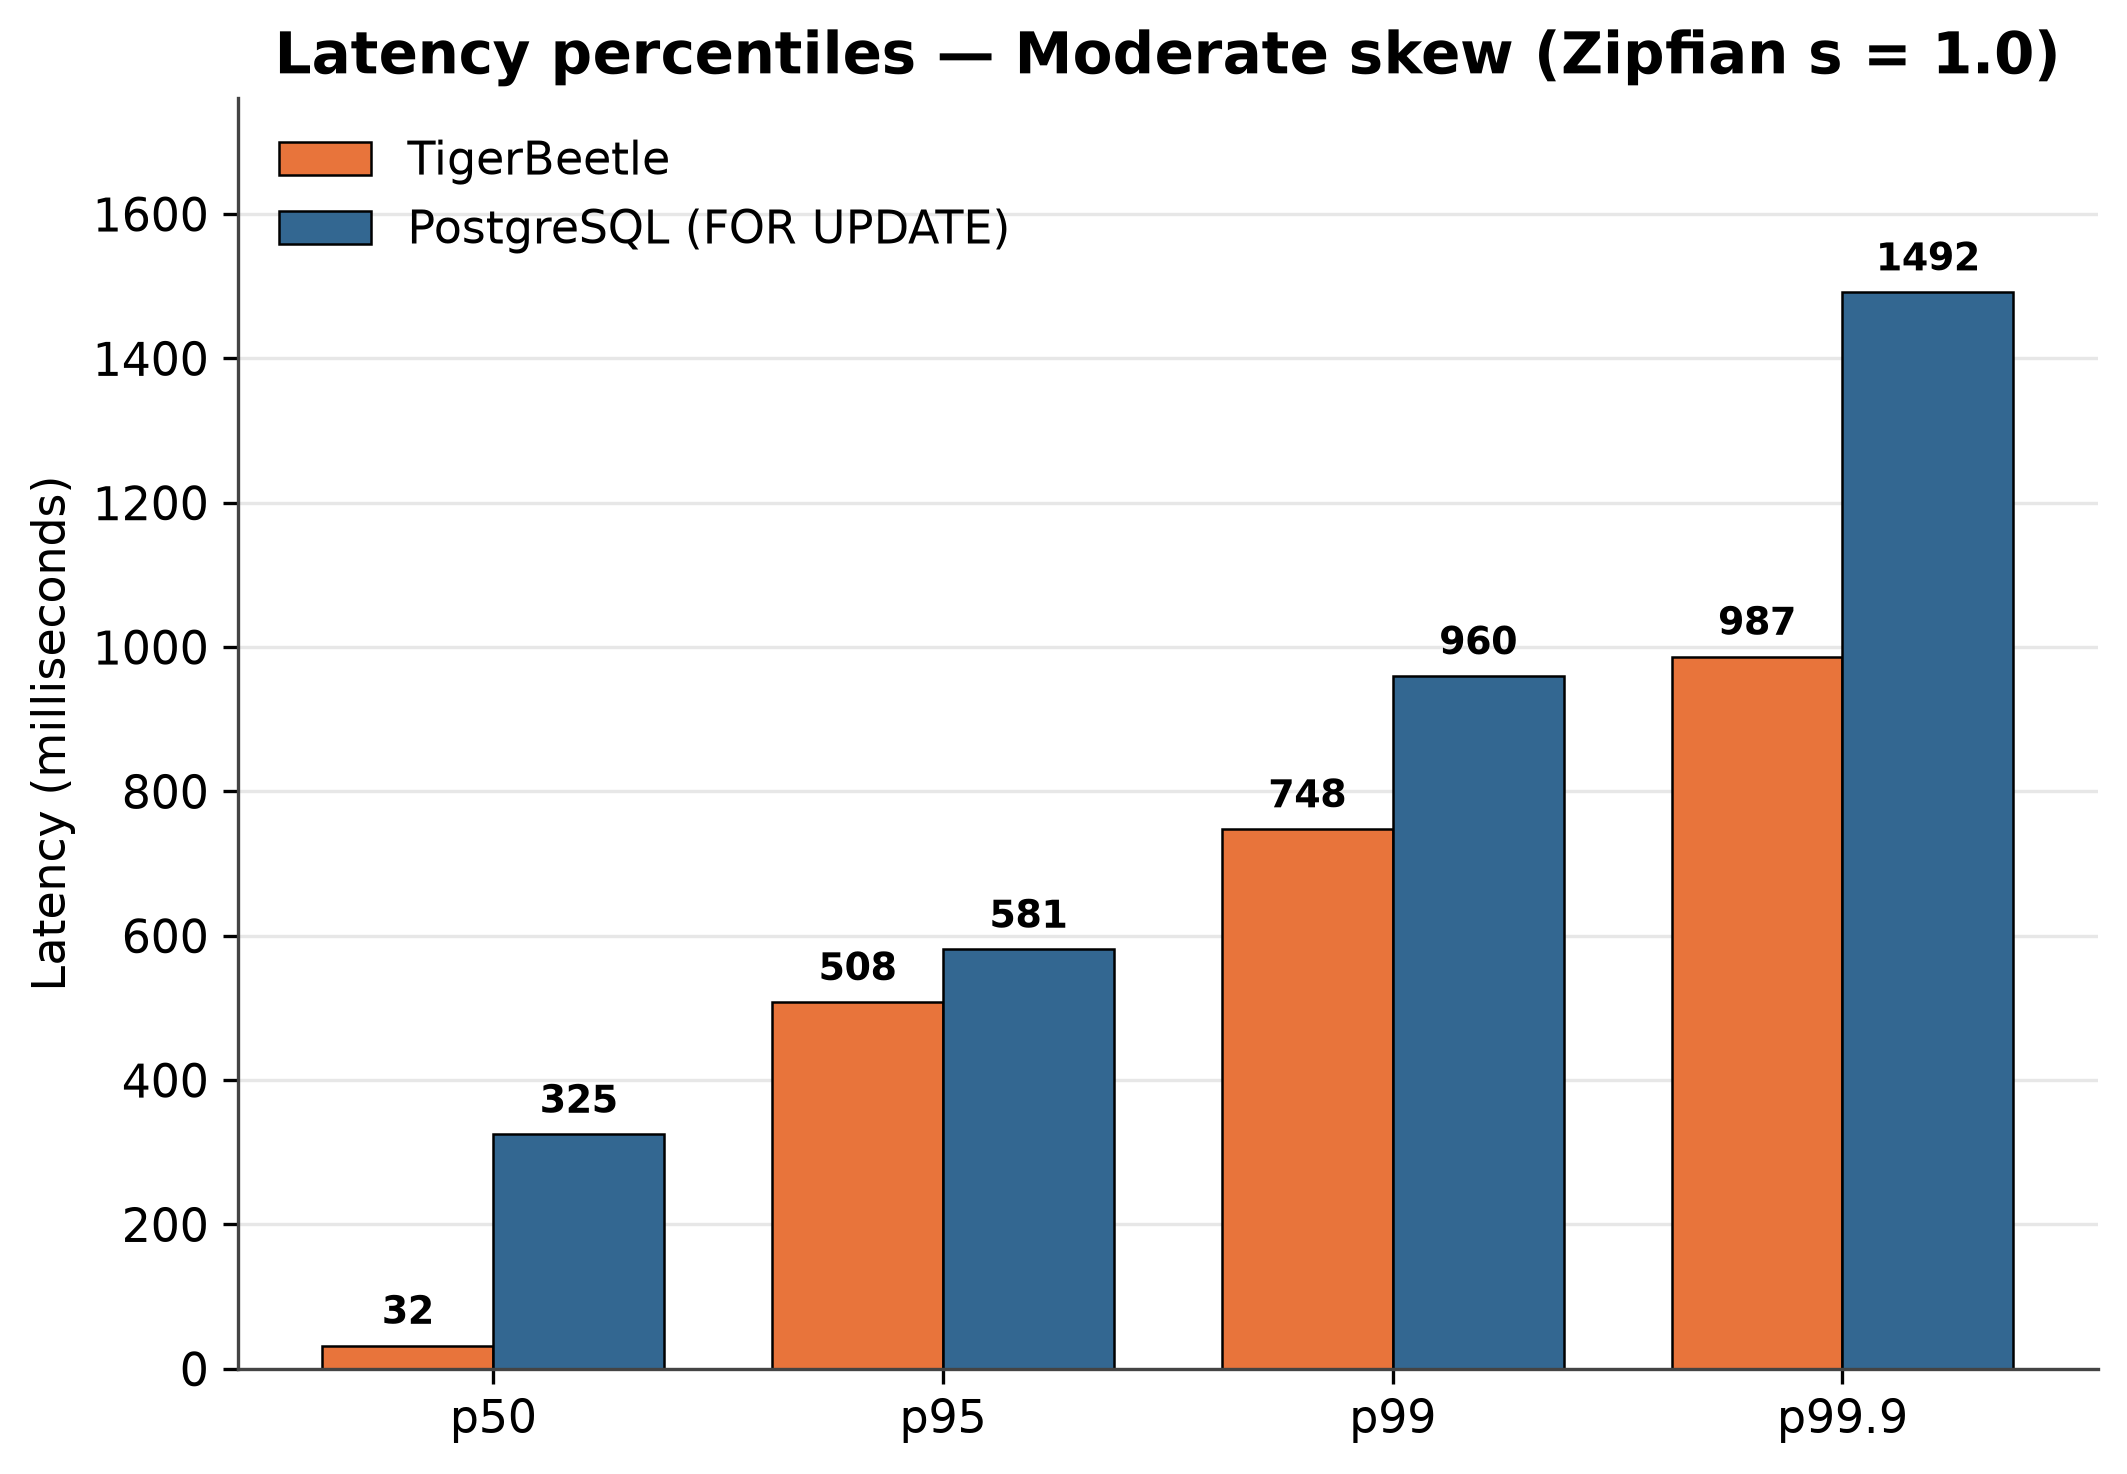
Also, let’s look at higher skew, where PostgreSQL starts to slow down significantly.
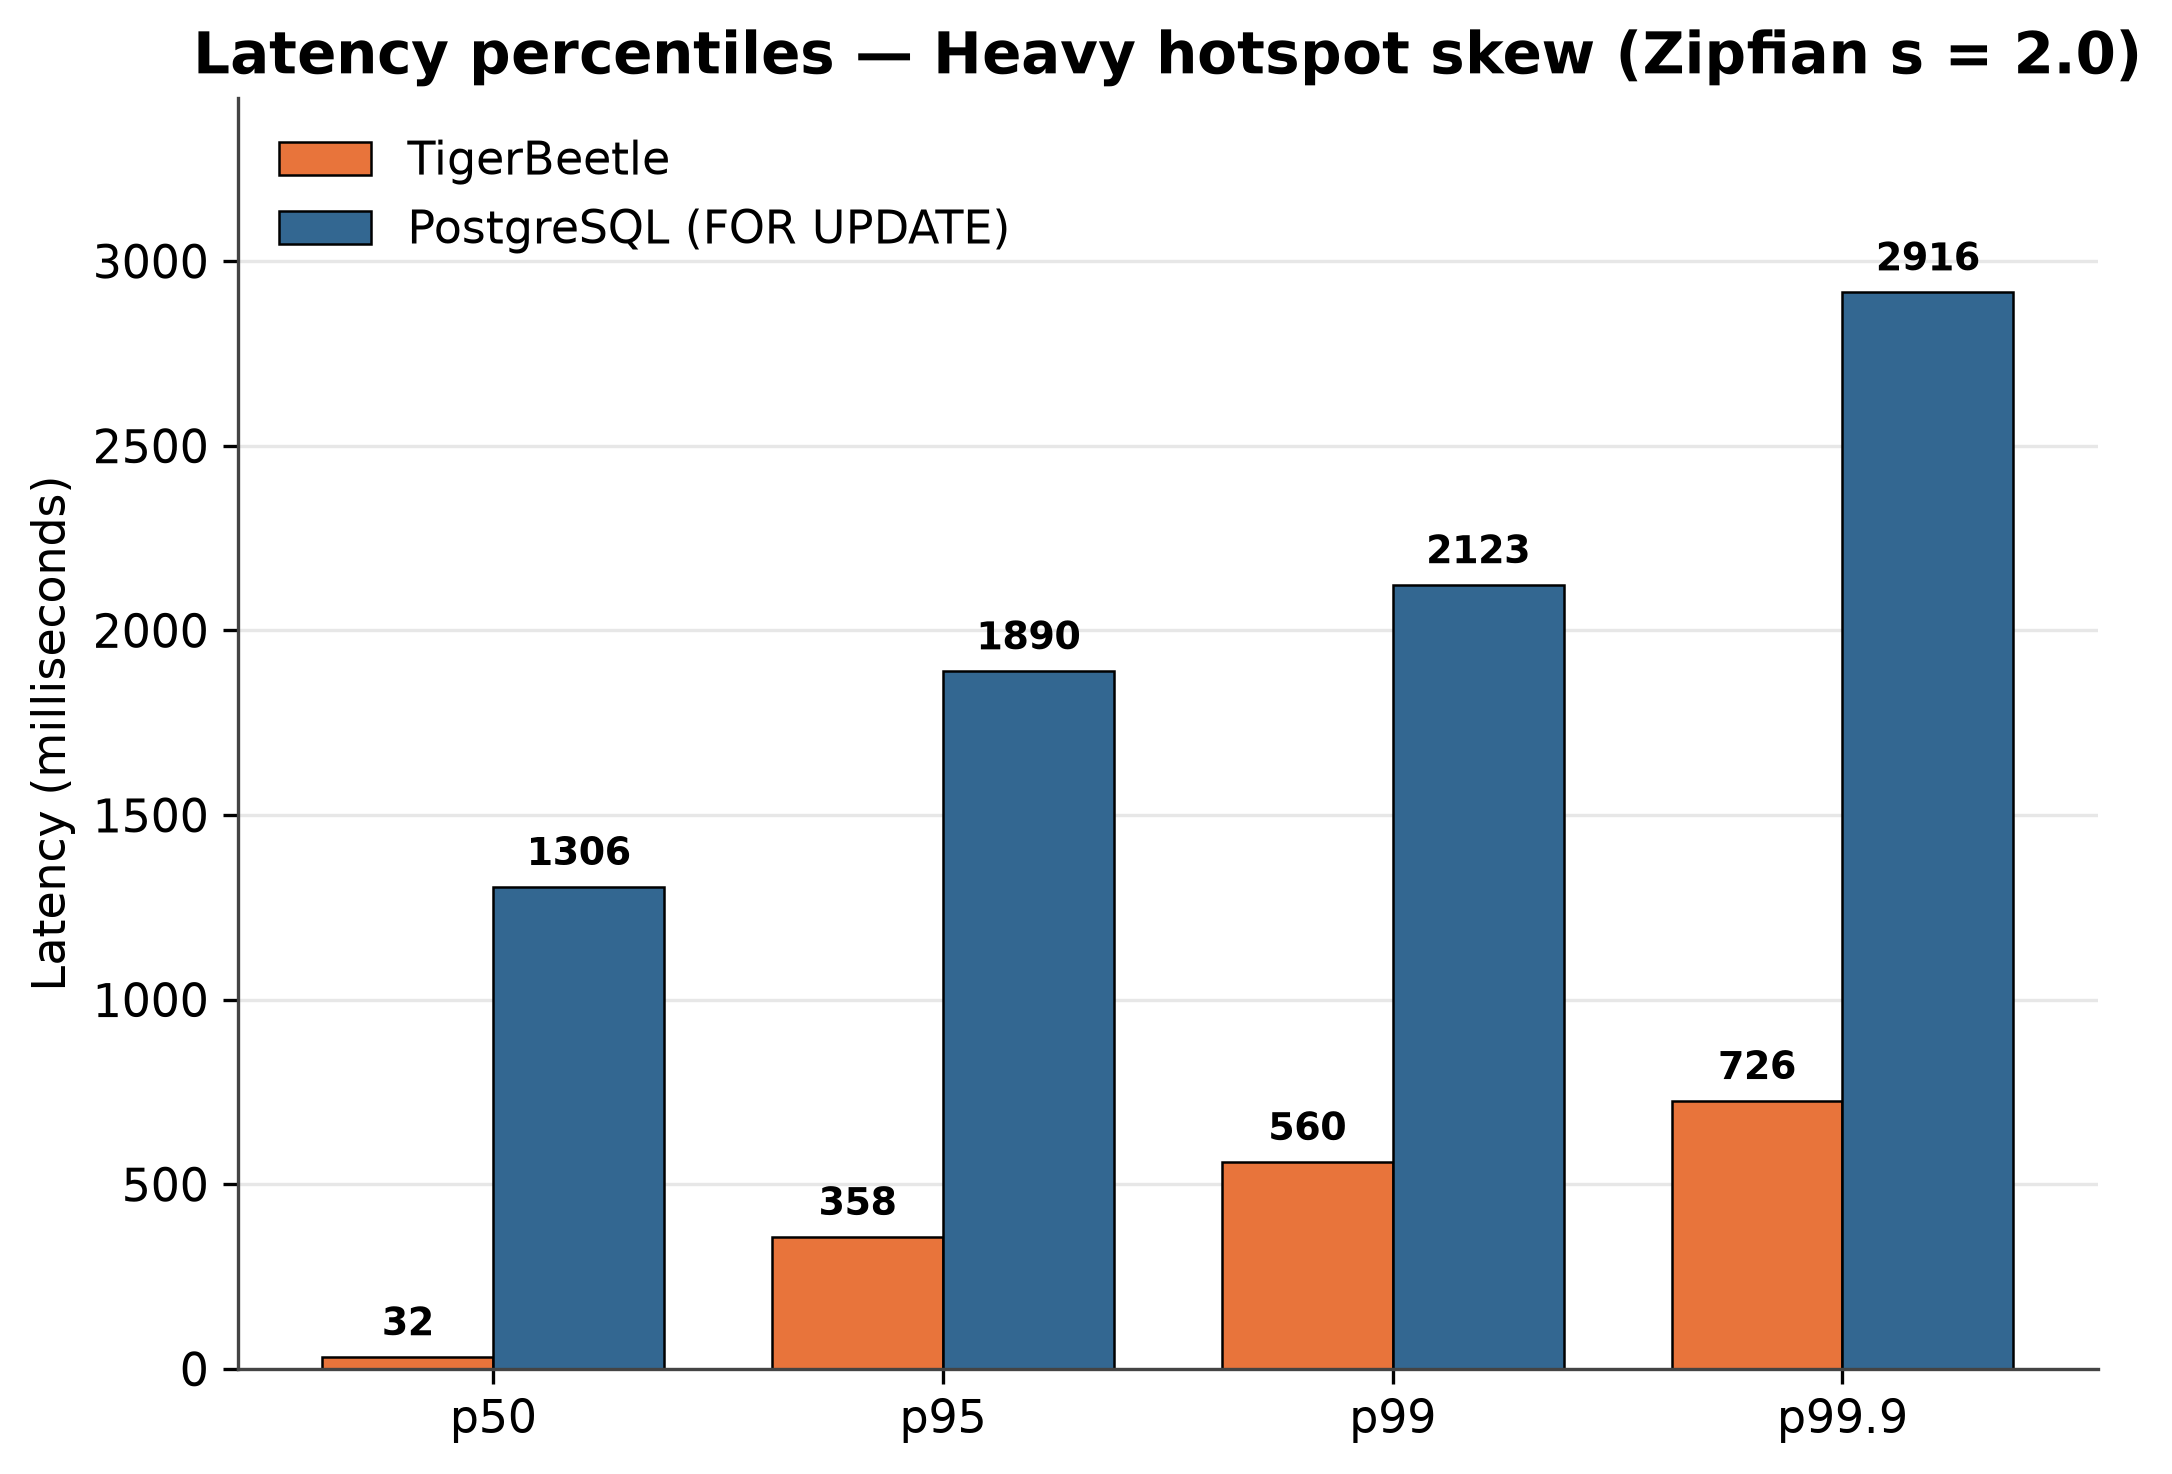
We can clearly see that locking isn’t the best option - with more “hot” accounts, the latency only grows when on TigerBeetle, it is even lower.
Headline takeaways
- TigerBeetle wins on every metric in both skew regimes. It has 40% higher throughput under moderate skew and ~4.6x higher under heavy hotspot skew. It also has much lower latency, ranging from 4x to 40x lower.
- TigerBeetle actually got faster with higher skew (both in throughput and lower latency). More requests are rejected faster (due to insufficient balance) rather than being queued on a lock. The two PostgreSQL modes got worse under hotspot skew.
- Correctness held everywhere. For every test in every scenario, we pass the double-entry invariant. The differences are only in performance.
We can see that we cannot achieve 5k throughput even when TigerBeetle doesn’t appear to be under stress. This is due to the max_concurrency setting that was mentioned earlier. We had too many in-flight requests, so some of them were dropped. Seems like for PostgreSQL, throughput limit and latency are caused by locking, and that’s not the case for TigerBeetle. We will try to see what the limit is for TigerBeetle in this setup under heavy hotspot skew when we give more headroom with a bigger max_concurrency setting.
Pushing TigerBeetle to its limit
We set max_concurrency to 2.5x our desired request-per-second rate. This should prevent us from dropping requests on the client side when the database can still execute them. These tests run with hotspot accounts (Zipfian = 2.0), as this seems more likely in the real world.
| Metric | TigerBeetle | PostgreSQL Standard | PostgreSQL Atomic |
|---|---|---|---|
| concurrency5k | |||
| Mean throughput | 5,060 TPS | 683 TPS | 878 TPS |
| Dropped requests | 0 | 3.9M | 3.8M |
| rate10k | |||
| Mean throughput | 9,431 TPS | 703 TPS | 867 TPS |
| Dropped requests | 598K (~9%) | 8.5M | 8.4M |
| rate20k | |||
| Mean throughput | 20,257 TPS | not tested | not tested |
| Dropped requests | 0 | - | - |
| rate40k | |||
| Mean throughput | 40,388 TPS | not tested | not tested |
| Dropped requests | 0 | - | - |
| rate80k | |||
| Mean throughput | 81,171 TPS | not tested | not tested |
| Dropped requests | 0 | - | - |
| rate90k | |||
| Mean throughput | 91,165 TPS | not tested | not tested |
| Dropped requests | 0 | - | - |
| rate100k | |||
| Mean throughput | 101,497 TPS | not tested | not tested |
| Dropped requests | 0 | - | - |
| rate120k | |||
| Mean throughput | 107,112 TPS - only 89% of offered | not tested | not tested |
| Dropped requests | ~12% of offered load | - | - |
| rate160k | |||
| Mean throughput | 107,858 TPS - only 67% of offered | not tested | not tested |
| Dropped requests | ~34% of offered load | - | - |
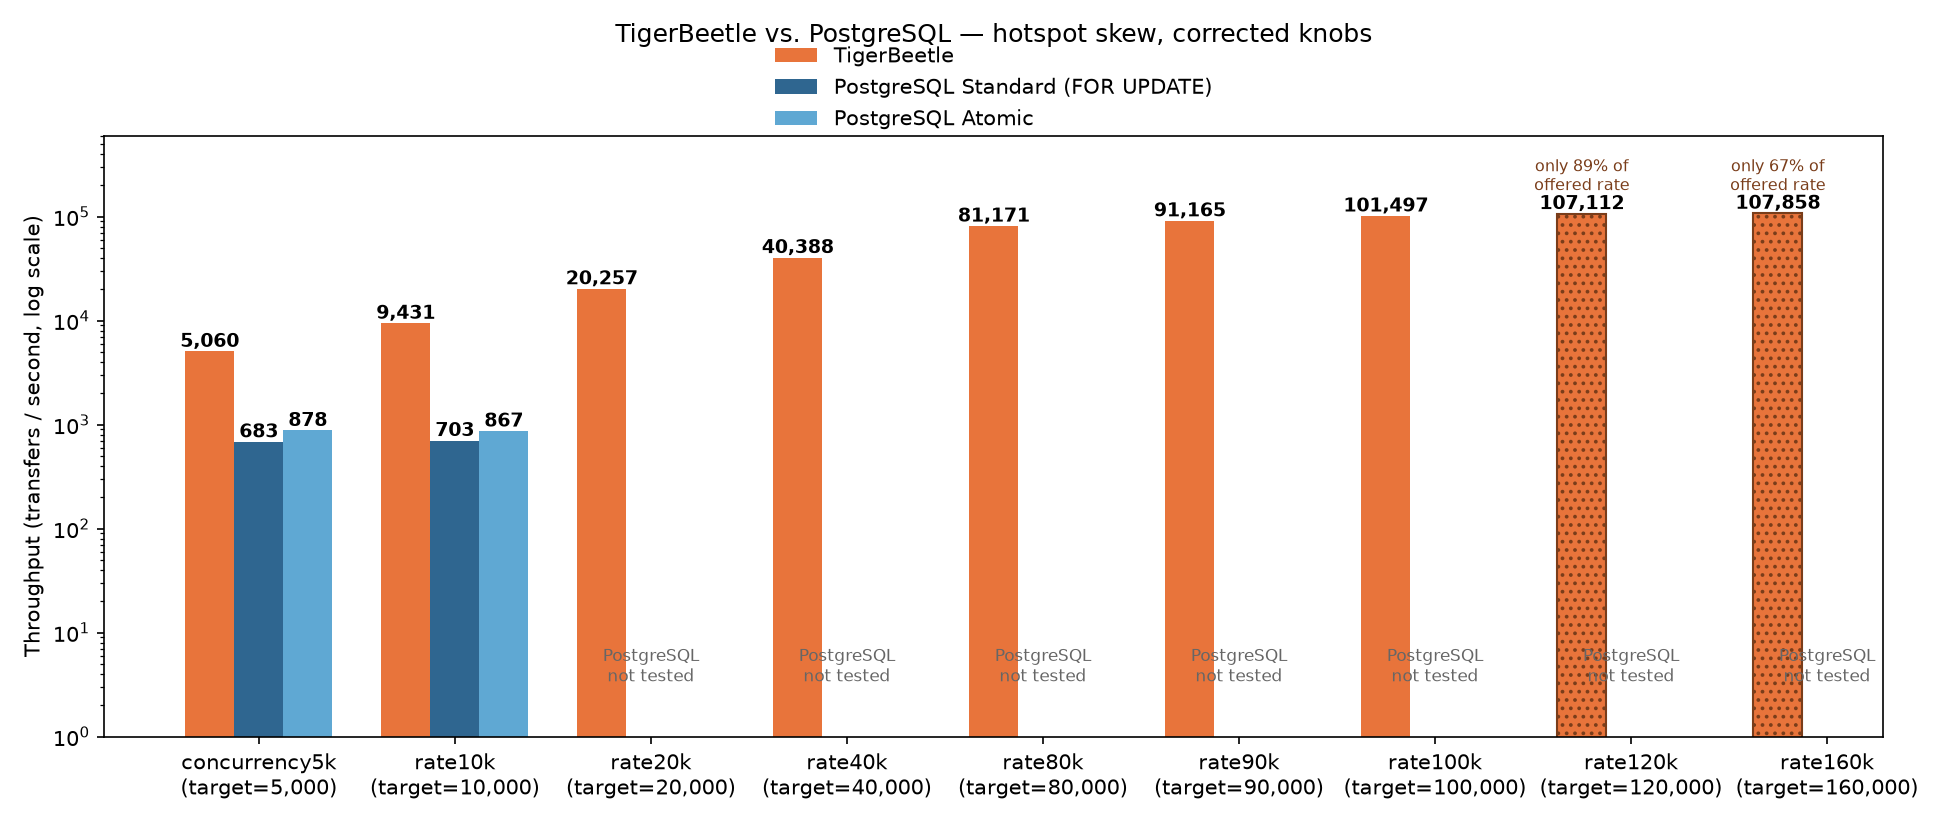
We can see that by allowing more in-flight requests simultaneously, we achieve the desired rate. For PostgreSQL, nothing changed significantly. On this setup, we were able to push TigerBeetle to over 100k requests per second. This shows how much of a difference specialized architecture can make. Let’s also look at latency, since we had to set max_concurrency higher, which might mean we experience higher latency.
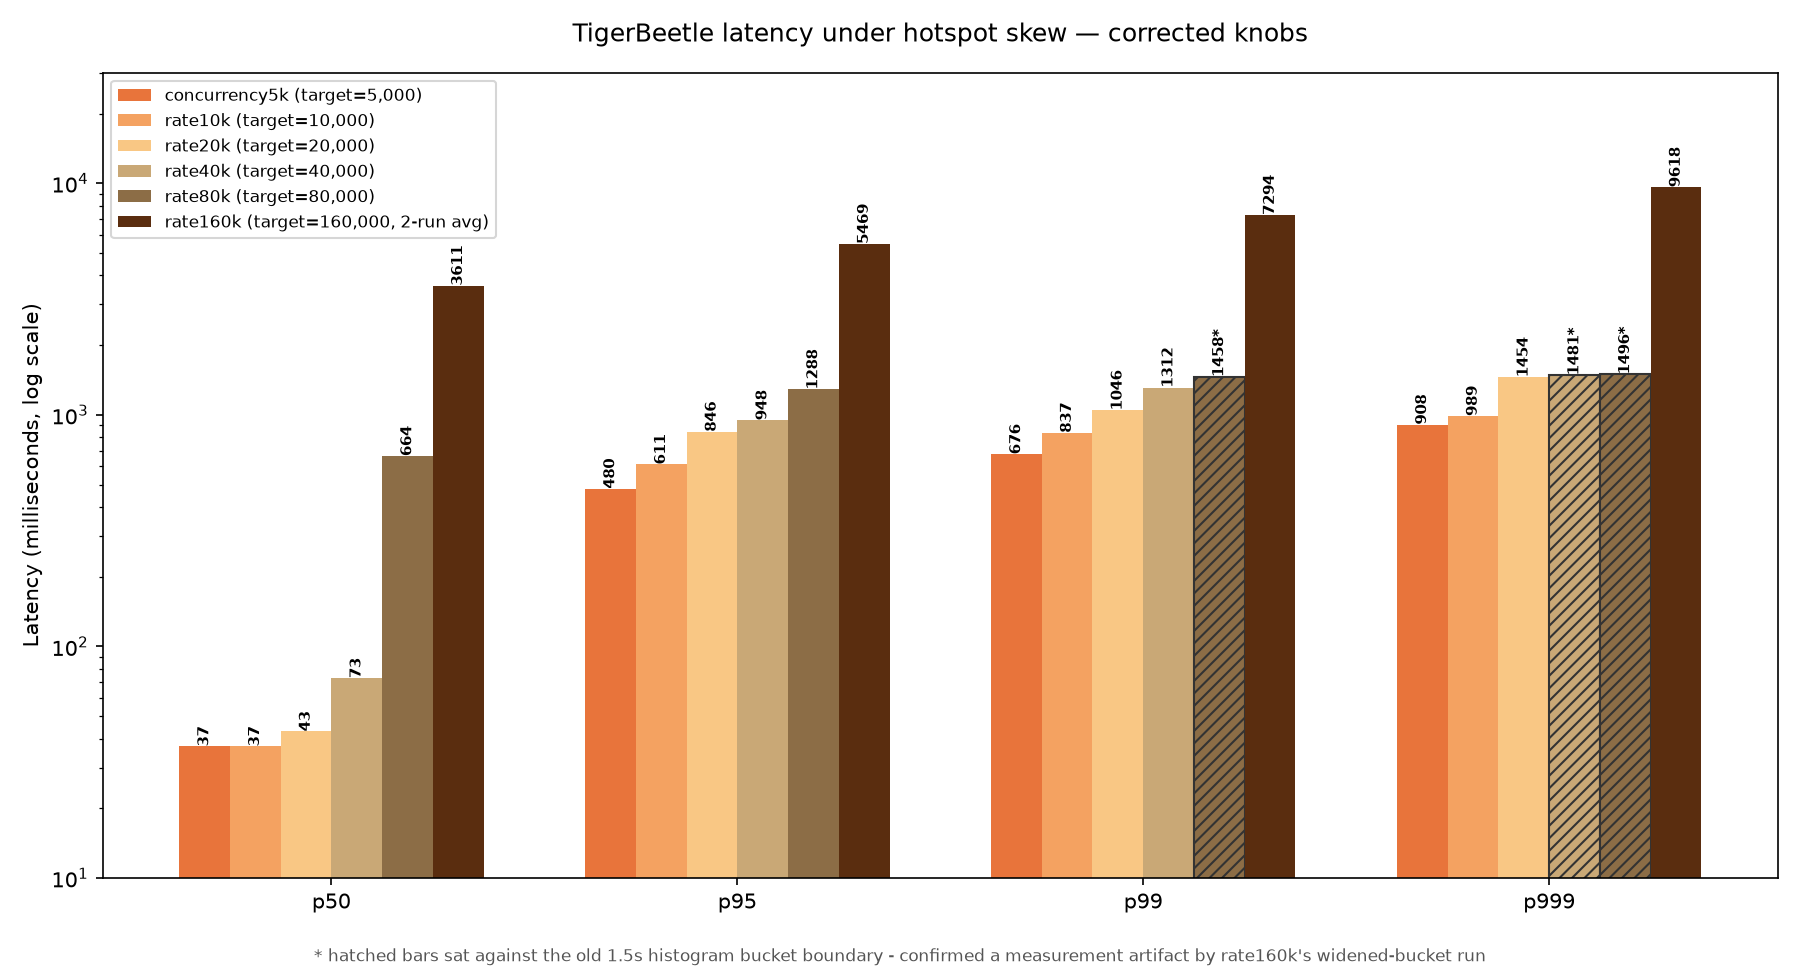
A note on the rate160k numbers specifically: they’re averaged from 2 of the planned 3 runs. The coordinator process was killed by a hard ~24.5-minute limit on the background task running it, hit on multiple attempts, always right as the third run’s balance verification was starting - after the first two runs had already completed and passed balance verification cleanly each time.
Hatched bars marked with an asterisk landed just below one of the client histogram's bucket boundaries - 1.5 s for rates 40k, 80k, and 90k, 4 s for rate 120k. Because Prometheus interpolates within a finite bucket, and the buckets above those boundaries existed but stayed empty, these are upper bounds.
Summary
TigerBeetle seems to deliver on its promise in our benchmarks. The database delivers reasonable latency, 70 ms, during heavy traffic, 40k requests per second. It does so while achieving over 5x higher throughput for our 5k test and 10x higher throughput for the 10k test than PostgreSQL. TigerBeetle can also deliver 100x higher throughput at the expense of latency, yet at 100k requests per second, we still achieve lower latency than PostgreSQL, which serves only 5k requests per second. We tried to replicate a more realistic environment and workload to test both databases, and the differences remain visible: TigerBeetle’s lower latency, higher throughput, and more consistent behavior despite the different workload.