Cassandra Monitoring - part I - Introduction
This is the first part of the Cassandra Monitoring miniseries, index of all parts below:
- Cassandra Monitoring - part I - Introduction
- Cassandra Monitoring - part II - Graphite/InfluxDB & Grafana on Docker
Cassandra Monitoring
In this series we would like to focus on the Cassandra NoSQL database monitoring. If you would like to read more about general metric collection then you can find a great post on the DataDog Blog. Here, we are not going to focus on what specifically you can gather from Cassandra, but rather how. Again, for details about different Cassandra metrics see the another DataDog blogpost.
In the upcoming parts we are also going to present our open source contributions which make Cassandra monitoring easier and more effective.
Nodetool
Everybody who uses Cassandra knows nodetool. It is a basic tool, bundled in the Cassandra distribution, for node management and statistics gathering. Under the hood it is just a Python console application. Nodetool shows cluster status, compactions, bootstrap streams and much more. It is a very important source of information, but it's just a CLI tool without any storage or visualization capabilities. For comfortable monitoring, and to get a better understanding of what hides behind all these numbers, we need something more, preferably with a GUI.
It is worth noting that Cassandra commiters find it important to not change output structure of nodetool, because people might have scripts based on them.

JMX & Reporters
Cassandra exposes all its metrics via JMX (by default on port 7199).
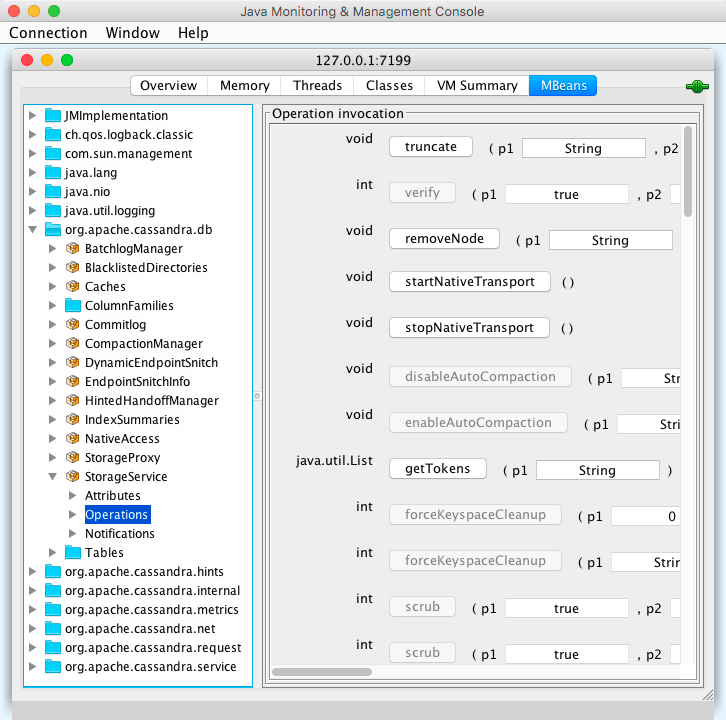
JMX can be read e.g. with jconsole or jvisualvm with VisualVM-MBeans plugin (both tools bundled in JDK distributions).
The JMX interface also offers some management features! For example under org.apache.cassandra.db.StorageService you can find operations related to node removal, drain, table snapshoting and more.

Note: by default remote JMX is disabled. If you really need it, you can enable it in cassandra-env.sh.
For metrics gathering Cassandra internally leverages io.dropwizard.metrics (only from version 2.2, previously library was named com.yammer.metrics and to be more confusing io.dropwizard.metrics uses com.codahale.metrics package names). Those are the metrics presented via JMX. However, it is possible to access them in a different way. Cassandra 2.0.2 and up allows to configure reporters, so that every configured period Cassandra forwards those metrics e.g. to Graphite. This is implemented by metrics-reporter-config library (see CASSANDRA-4430) and provides a nice automatic way to process metrics in different systems, store and display them or check for alarms.
We will cover the concept of reporters in more detail, in the next part of this blogpost series.
DataStax OpsCenter
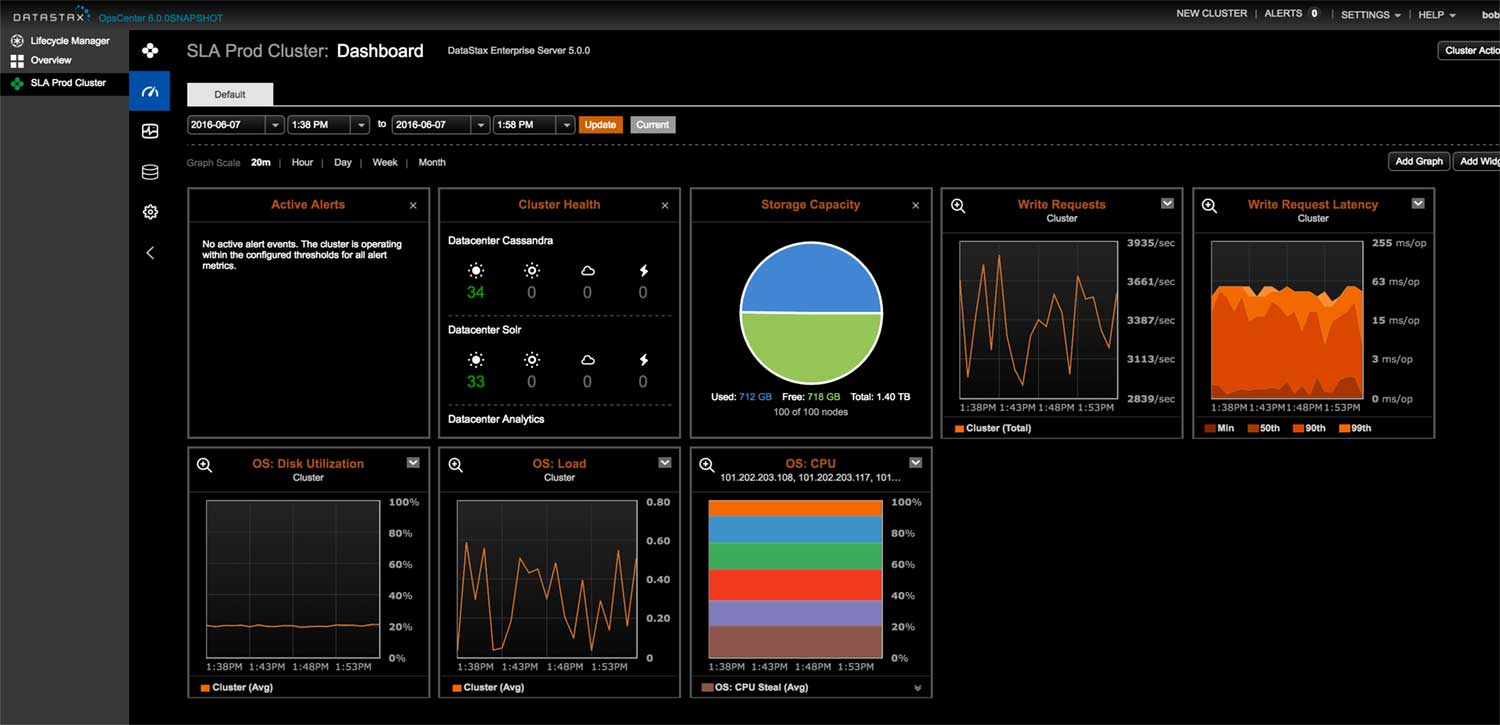
OpsCenter is a monitoring and management solution. It is also capable of system monitoring. Every node needs to have an OpsCenter agent installed, which sends data to the main OpsCenter service, which in turn stores them in a Cassandra keyspace. It is recommended to have a separate Cassandra cluster for storing OpsCenter data, so that OpsCenter activity won't be seen among the presented metrics. The application is also able to manage the cluster, add/remove nodes and more. However, the "free" OpsCenter is compatible with the open source Cassandra up to version 2.1. The new OpsCenter 6.0 is available only for DataStax Enterprise 4.7+ (based on Cassandra 2.1) and 5.0 (based on Cassandra 3.0). The Documentation shows more detailed compatibility matrix.
In other words if your cluster uses open source Cassandra 2.2 or 3.x then OpsCenter is not for you.
DataDog
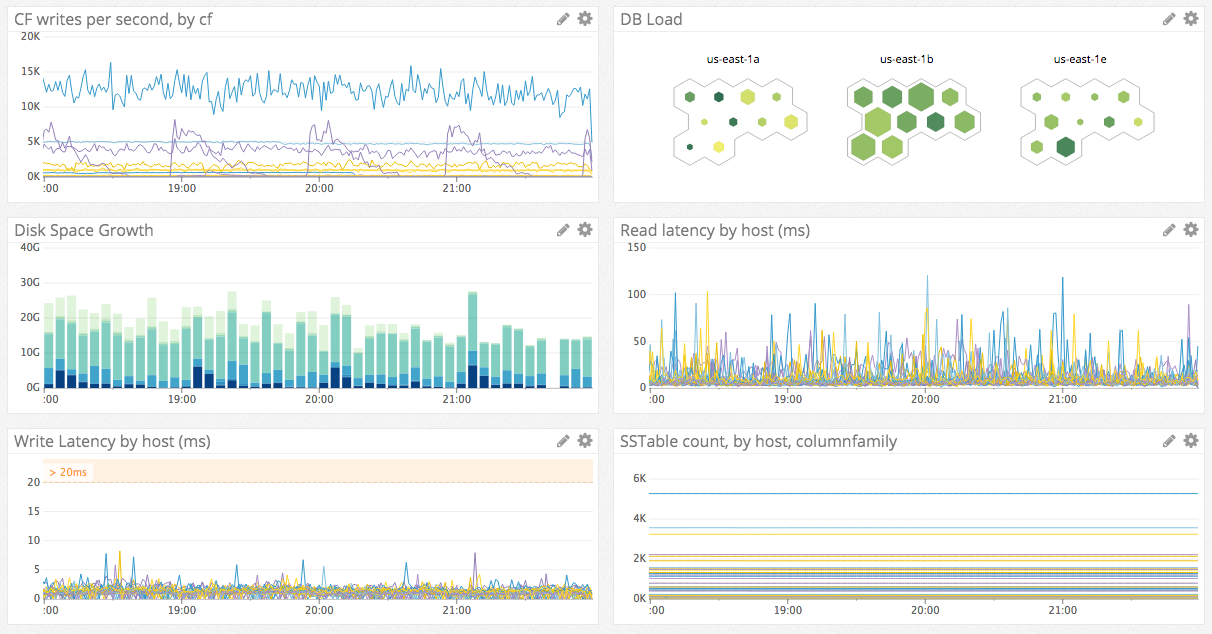
In contrast, DataDog is a SaaS solution. It is capable of monitoring, but also supports a lot of other databases and services. However it is free for only no more than 5 hosts with major limitations.
DataDog requires an agent installed on every Cassandra node. It reads Cassandra logs and metrics using JMX. The agent is open source so you can check what exactly it’s doing.
Conclusions
There are a lot of options for Cassandra monitoring (and management), however none of them are perfect. If you are still using open source Cassandra 2.1 or below, or DataStax Enterprise, then you can use OpsCenter. If you are open to Cloud and SaaS then DataDog monitoring might be for you. Otherwise, you might be interested in Cassandra reporters and solutions based on Graphite or InfluxDB and Grafana which we will describe in the next parts of this blog series. We will compare the different options and show how to configure them for different Cassandra versions.
If you want to dive deeper into the topic of metrics, then these links might be interesting for you (some quoted already in the article):


